ISRAEL SUBDISTRICTS
- Territory Guide
- ISRAEL SUBDISTRICTS
Add Israel subdistricts to your map and enhance your spatial analysis and operations. Whether you’re in dispatch, logistics, sales, or operations, having access to Israel subdistrict maps can provide invaluable insights for optimizing your business strategies. By mapping these connections, you’ll make bold, strategic moves that elevate service delivery, streamline operations, and keep everything running smoothly across diverse regions.
From route planning to market analysis, these maps offer a comprehensive view of regional data that can empower your decision-making processes and drive business growth. Let’s dive in and unlock the full potential of your maps with Israel subdistricts!
WHAT ARE ISRAEL SUBDISTRICTS?
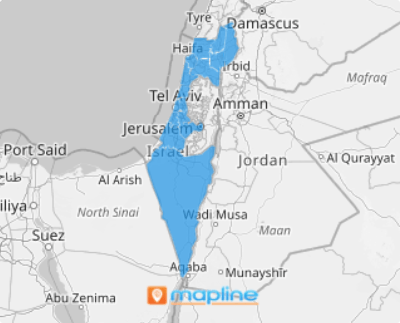
Israel has 15 subdistricts, or administrative divisions, also know as nafot. Subdistrict boundaries are your secret weapon for driving economic expansion. These areas are invaluable for brands seeking to enhance their operations or analytics, offering the opportunity to tap into unique regional insights.
For instance, a sales team might analyze population data within each subdistrict boundary to determine the best areas for business. Here’s how to create this powerful map and see precisely what your business needs, in minutes.
ADD SUBDISTRICTS TO MAP
Visualizing patterns within subdistrict boundaries unlocks new opportunities—revealing market potential, spotting regional trends, and uncovering where your customers are concentrated. With a subdistrict map all set up, you can readily analyze and interpret your data and drive insights and strategies!
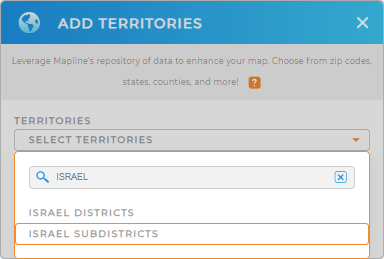
To accomplish that, add a new territory from Mapline’s repository, and type ISRAEL into the searchbar.
Select ISRAEL SUBDISTRICTS from the drop-down and you’re good to go! Let’s move on to Step 2.


Pro Tip: Explore different territories for Israel including Israel districts and sub-districts when you leverage Mapline’s Repository of territory boundaries. Discover the best territory management for your business and effortlessly streamline operations and seize market opportunities.
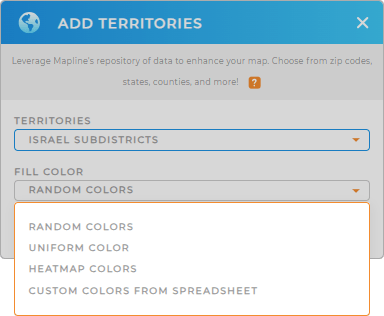
CHOOSE SUBDISTRICT COLORS
Find innovative solutions to real-world business challenges when you incorporate colors into your map. That’s the power of data visualization!
Say goodbye to analysis that takes grueling hours or days. Instead, get the insights you need in minutes, so you can focus on what really matters for your brand.
Just select the type of color styling you prefer, then click OK. And that’s it! Now your map is ready to use.

GET NEW TERRITORY INSIGHTS
Woah, wasn’t that easy? Now you can analyze your data with some of these incredible capabilities:
- Label your territories with key information for quick reference
- Segment your franchise locations and promptly access relevant information
- Take advantage of folder reports and dive into the data behind your territories


