
BUILD CUSTOM SALES TERRITORIES
- How To Guide
- BUILD CUSTOM SALES TERRITORIES
Get ready to supercharge your territory planning and create precise sales territories in just a few clicks!
Say goodbye to the hassle of constantly redrawing boundaries. Instead, let your data inform territory creation, empowering you to craft territories that fit your business like a glove.
In moments, you can auto-generate territories based on your ideal factors: rep locations, customer density, historical insights, buying power, you name it. Instantly spot overlap, tweak boundaries, and fine-tune coverage in seconds. You can even add demographic data or create multiple territory versions for comparison – all with ease.
And the best part?
It’s all automated! Eliminate guesswork and let your data–and Mapline–do the heavy lifting. Then, you can focus on what you do best: leading your team to success.
CONFIGURE YOUR DATA
Before diving into territory creation, let’s configure your dataset with the key information that will inform how your territories are built. Start by ensuring your dataset includes columns like:
- Assigned Rep: The name of the sales representative responsible for each location
- Region Name: Group locations by region to keep territory boundaries aligned with your existing operational structure
- Division Name: For larger organizations, defining divisions can help create territories that align with internal departments or geographic areas
- Historical Sales: Include sales data to help balance territories based on revenue potential, ensuring each group has equal opportunity
- Distance from Nearest Rep: Add a column calculating the distance between locations and their nearest assigned rep. This helps create more efficient territories, minimizing travel time and maximizing customer contact
Once your dataset is configured with these essential details, you’re ready to create territories that align with your business strategy. Here’s how!
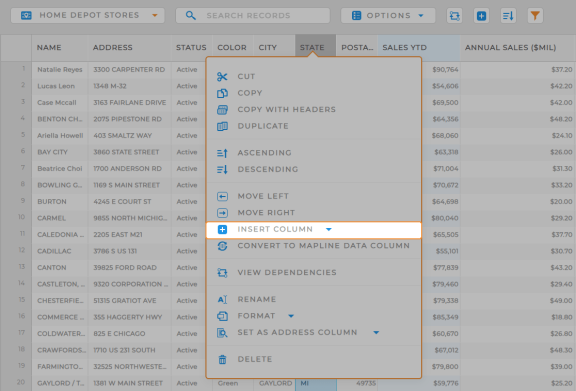

Pro Tip: Add a Mapline Data column to quickly run distance calculations or assign categories to your locations in a flash! This is a powerful way to add new information to your dataset without typing it in manually.
CREATE CUSTOM TERRITORIES
Ready to add custom territory boundaries to your map? Let’s do it! From your map, click the ADD button in the top menu, hover over TERRITORIES, and select USING MAP LAYER PINS.
We’re going to explore different ways to create territories from a column in your dataset, enabling data-driven boundaries that skyrocket your ROI.
Just select the dataset you used in the previous step and it’s time for the magic.
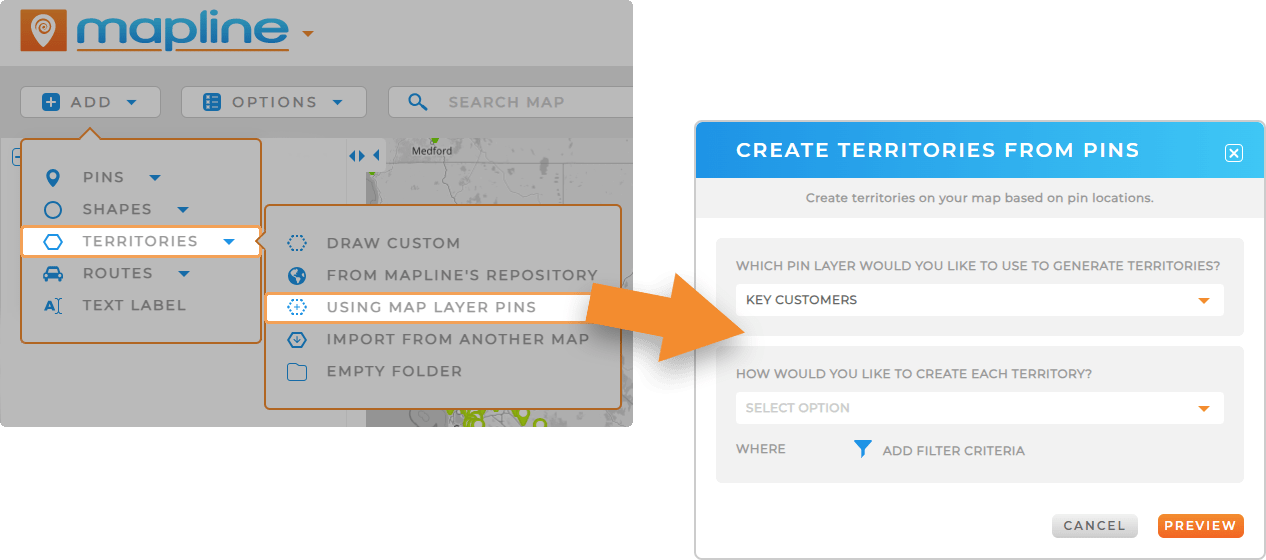
CREATE TERRITORIES FOR EACH REP
Easily draw territories around each rep’s assigned locations. There’s no better way to ensure each rep has a manageable area to cover, reducing travel time and increasing efficiency.
Apply any filter criteria you need, like only assigning qualified leads or territories with active customers, to ensure your team is always focused on the most promising opportunities.
Next, define your outer boundary:
- PROVIDE AN OUTER BOUNDARY BUFFER DISTANCE: Specify a buffer distance around the edge of each territory. This creates a clear, defined perimeter for each territory, helping to avoid overlap and confusion.
- SELECT A TERRITORY TO USE AS THE OUTER BOUNDARY: Snap your boundaries to existing government lines, like county, zip code, or state, ensuring uniform maps without overlap. This makes your territories easy to understand and manage, aligning them with recognizable geographical boundaries.
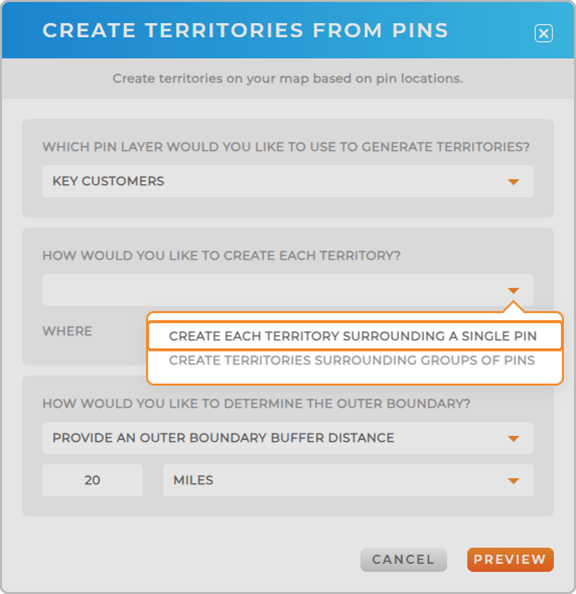

Pro Tip: Use any dataset column to shape your territory borders—think regional assignments, average deal size, service area coverage, or revenue per customer. The possibilities are endless!
CREATE REVENUE-FOCUSED TERRITORIES
Alternatively, you can manually set the values that define your pin groupings.
For instance, if you want each pin group to generate at least $50,000 in annual sales, select your YTD sales column from the drop-down menu, then type 50,000 as the total group value.
Apply any filters you need, then click OK.
There’s no more powerful way to create revenue-balanced sales territories. And there’s so much more you can do here. Consider:
- Focusing on high-value client distribution
- Optimizing territories for current sales campaigns
- Aligning your territories with market development initiatives
- Creating territories based on revenue potential to give everyone a fair chance of meeting their targets
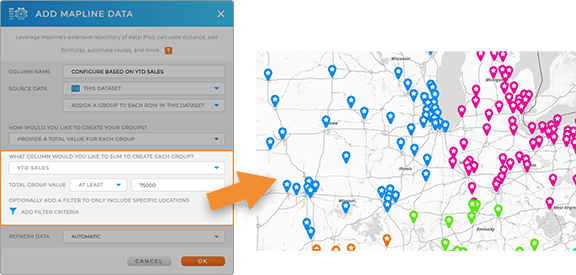
GENERATE TERRITORIES FROM LOCATION CATEGORIES
Easily create a custom number of groups, allowing you to define territories that suit your needs. You can assign one group per sales rep, or even create territories based on the number of home offices or another data point that fits your strategy.
This option is perfect for balancing workloads and optimizing sales routes. It helps ensure your team spends more time with customers and less time on the road by organizing locations in an efficient way.
Start by choosing how to group the pins:
- MINIMIZE DISTANCE TO GROUP CENTER POINTS: Ensure each location is as close as possible to its group’s central point, minimizing travel distance
- EQUALIZE THE NUMBER OF PINS IN EACH GROUP: Ensure each group contains the same number of locations
- EQUALIZE THE TOTAL COLUMN VALUE OF EACH GROUP: Ensure each group has the same total value, such as YTD sales
Then, enter the number of groups you want to generate and apply any necessary filter logic.
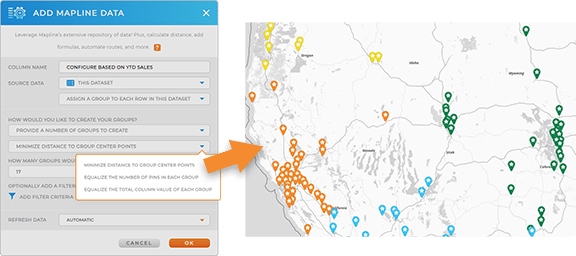

Pro Tip: If you’re unsure which criteria would create the best territories, repeat this step with different criteria each time. Once you have several new dataset columns, use Segments to compare and contrast each pin grouping. This powerful technique allows you to preview potential territories before drawing the final boundaries on your map.
CUSTOMIZE TERRITORIES
Congratulations! You’ve created a custom territory map with boundaries directly informed by your data. This map will dramatically enhance your sales operations and help you hone in on the insights you need.
In the ever-changing landscape of sales, adaptability is key. That’s why we’ve streamlined the process of editing, reshaping, or merging territories, giving you the flexibility to adjust as your business needs evolve.
Plus, with the ability to create copies before merging territories, you can confidently experiment with different configurations and find the best fit for your needs.
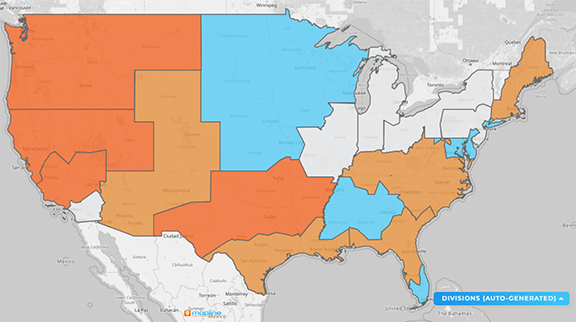

Pro Tip: Amp up your analysis and import a spreadsheet of your competitors’ locations to gauge market presence and gain a competitive edge like never before!
ANALYZE & OPTIMIZE
Creating your territories is just the tip of the iceberg! Now, you have a robust map that offers new insights into your sales operations, market presence, and customer base.
Now you can monitor performance, segment your audience, view territory data, and run advanced calculations within your territories to unveil even deeper insights. Plus, get started building a holistic system to manage all of your sales operations and put yourself ahead of the curve this quarter:
- Create instant customer maps & monitor sales acitivites in real-time
- In seconds, create smart routes that reduce mileage and increase time spent with clients
- Create custom dashboards so you can monitor everything in real-time, all in one place


