
Monitor Team Performance &
Automate Reporting
- How To Guide
- Monitor Team Performance & Automate Reporting
When you’re monitoring and optimizing your team’s performance, spreadsheets and notes in Salesforce don’t always cut it. You need real-time, laser-focused insight into their activities, complete with territory-specific data that illustrates the factors impacting sales.
Your reporting needs to be efficient, streamlined, and accurate, with intuitive visualizations that make analysis a breeze.
Forget the hassle of manually exporting endless documents, pouring over rows of data, and wondering why one sales rep is overperforming while another can’t keep pace.
Instead, gain real-time visibility into your team’s whereabouts and actions 24/7. Get the insights you need to optimize performance and close more deals than ever before.
Free up valuable time spent on tedious reporting and data aggregation by automating and streamlining everything. Then, you can focus on the insights that matter and create smart strategies that make waves in your industry.
Let’s dive in and set up a system that monitors team performance, automates all your reporting, and ensures accountability across the board. This way, you can get back to what you do best: boosting ROI and making your stakeholders smile.
MONITOR PERFORMANCE
With the world’s most powerful, geo-aware visualizations at your fingertips, you can monitor regional performance in real-time, instantly spot high-potential areas, and gain a clear understanding of team behavior and market trends.
And guess what? Once your system is set up, you won’t have to lift a finger to monitor performance – everything is automated so you can stay ahead of the curve without breaking a sweat.
AUTOMATE TEAM REPORTING
First, let’s ensure that you always have the most up-to-date information at your fingertips! Custom forms empower your team and customers to submit updates with pre-built, dynamic options that can even be customized to their current location. Capture key data that empowers you to track everything, including:
- Client Name
- Address
- Brand Name
- Visit Date
- Lead Stage
- Referral and Commission Updates
- Customer Availability
- Customer Notes
- Expense Receipts
- Time of Submission
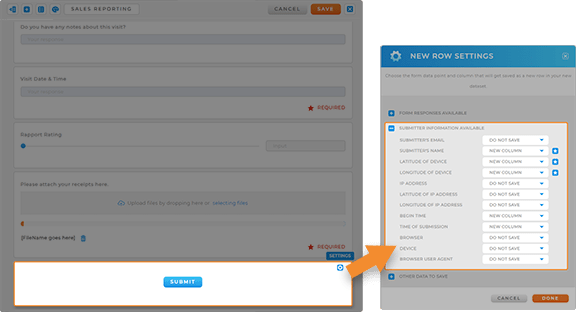
Set up dynamic options to auto-populate your forms with location-relevant information whenever your reps arrive on-site. Then, automate your communications and notifications with custom action triggers, ensuring that your team and customers stay informed.
Once you’re finished, you can easily share your form with your team or embed it on your website for easy access. This gives your team the power to collect leads no matter where they are.

Pro Tip: Leverage Mapline Data to automatically reassign leads to the next available rep whenever a visit is missed or canceled. Nothing ever falls through the cracks when you have a holistic system that accommodates hundreds of variables in the blink of an eye!
GENERATE VISUALIZATIONS
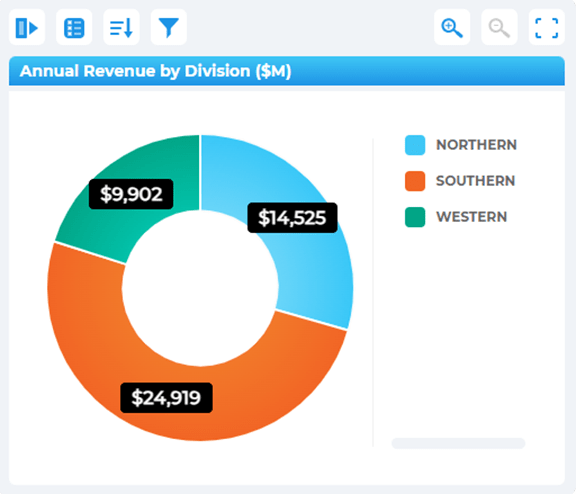
Next, let’s turn the data you’re collecting into stunning visualizations that empower you to dive right into analytics. Create a new chart or a new report in seconds, then customize your chart or report to ensure the right outputs.
Create as many charts and reports as you need, because in the next step, we’re adding them all to a custom dashboard so you can see everything in one place.
Segment your charts for an even deeper analysis of your team performance, customers, and leads. Visualize specific categories so you can see all of the factors impacting sales.
CREATE DASHBOARDS
Add your Mapline visualizations to a custom dashboard, keeping everything in one place so you can work smarter, not harder.
First, create a new dashboard and add the visualizations you need. You can even create multiple dashboards if you need to track different KPIs for different teams or business segments.
This is a powerful way to track sales team activities, expenses, and outreach campaigns.
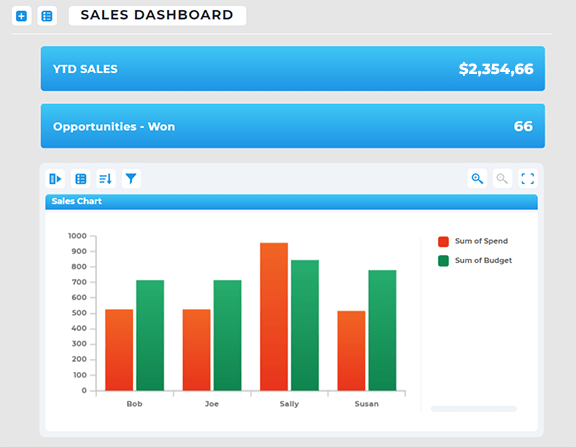

Pro Tip: For a quick snapshot of your KPIs, add metrics to your dashboard. This lets you visualize real-time stats, such as closed deals, visits completed for the day, mileage, reimbursements, or anything else you need to keep track of.
LEVERAGE TERRITORY DATA
Now, you’ve laid the foundation to monitor your operations and keep a high-level overview of your team’s activities and performance. But your system would be incomplete without leveraging your territory data and learning about the factors that impact expenses and ROI. Let’s review some powerful ways to generate new insights that help you level-up your strategies and operations!

PRO TIP: For a quick snapshot of your KPIs, add metrics to your dashboard. This lets you visualize real-time stats, such as closed deals, visits completed for the day, mileage, reimbursements, or anything else you need to keep track of.
ACCESS TERRITORY DATA
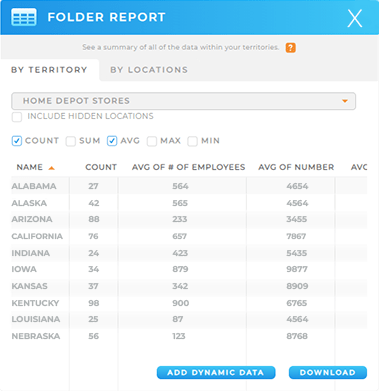
Get territory-specific insights with territory reports. Here, you can extract valuable data from your territories, including viewing sums, counts, averages, or sorting data by location.
But that’s not all! See average sales, customer counts, or compare your performance metrics across different regions!
This is the key to informed decision-making and fully harnessing the power of your data.

Pro Tip: Seamlessly connect your systems with Mapline to securely share data between your programs and ours. Know with 100% certainty that your decisions come from your data, every single time–all without lifting a finger!
ENHANCE WITH DEMOGRAPHICS
Seamlessly incorporate demographic data into your visualizations and hone in on high-value neighborhoods at a glance.
Calculate the population within a map territory, or display the average household income around each of your business locations in just a few minutes.
Once you add U.S. demographic data, a new column appears in your dataset, ready to be visualized on your map through labels, heat maps, or territory pop-out bubbles. Alternatively, use it for advanced calculations that inform data-driven decisions for your organization.
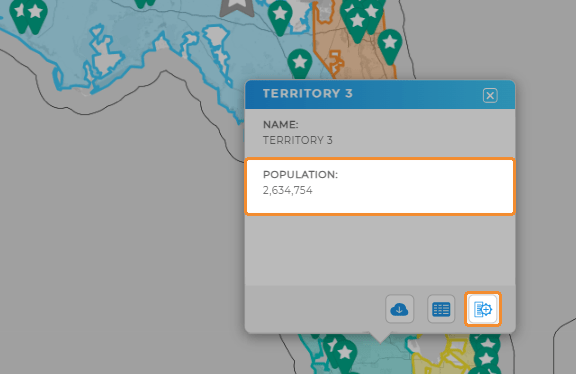

Pro Tip: Mapline provides the most up-to-date demographic data available worldwide, eliminating the guesswork from your decision-making process.
RUN DISTANCE CALCULATIONS
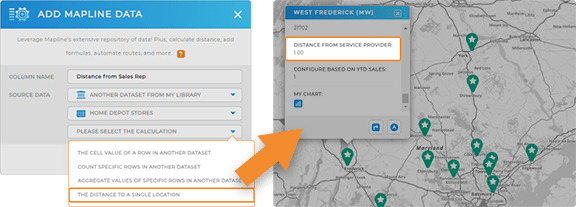
The true power of Mapline is when you leverage your location data to learn how it impacts operations. Get distance analytics in minutes so you can optimize your strategies better than your wildest dreams!
Leverage Mapline Data to run distance calculations, or access any formula available in Excel (and even some that aren’t!). Once you finish configuring your calculations, a new column appears in your dataset with the information you generated. You can leverage this data in your routes or future calculations, or use it to segment your audience and generate smart sales territory boundaries.
MONITOR & OPTIMIZE
Now you can see exactly who is where and which actions they’ve completed, 24/7! Your custom reports, charts, and dashboards give you the power to strategize with geographic data in mind so you can see, test, and validate strategies before implementation.
It’s easy to securely share data with your entire team, ensuring everyone has the information and access they need to succeed. And when it comes time to strategize, you can run advanced calculations in minutes, import demographic data, and compare and contrast strategies—all in one place.
Now that’s some powerful stuff! Here’s to staying ahead of the game and catapulting your team to success.


