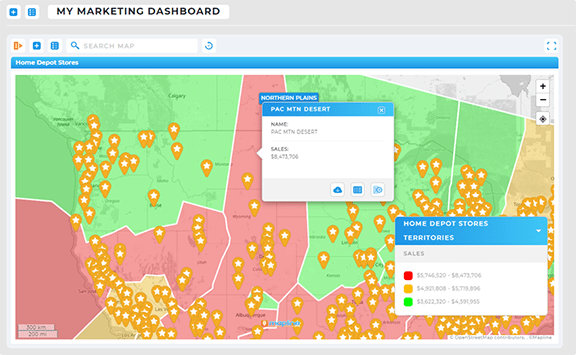
Run a Comprehensive Market Analysis in Minutes
- How To Guide
- Run a Comprehensive Market Analysis in Minutes
Every day, you’re navigating the chaos of the business world. You’ve got the best crew, the finest ship, but there’s one problem—your compass and maps are outdated. Your data analysis is complex and manual, you lack real-time insights, and your data is often spread across multiple platforms and departments, making it difficult to get a cohesive view.
Sound familiar?
If you can’t see where you’re going, it can feel like you’re always a step behind, struggling to adjust your strategies quickly enough to make an impact.
That’s why you need a powerful system that analyzes market dynamics on demand. Then, anytime you need to know something about your audience, you have vital information at your fingertips such as market share, audience demographics, regional customer hotspots, and market saturation.
This system empowers you to allocate your marketing resources more efficiently, identify which markets need more attention, and rapidly adapt your strategies based on the latest insights.
Let’s explore how to transform your marketing strategy with an in-depth, comprehensive market analysis that only takes a few minutes. Get clear, actionable data that keeps you ahead of the game.
And the best part? Once you set up this system, you’ll be able to analyze your market over and over with just a few clicks of your mouse! Check it out.
CALCULATE YOUR MARKET SHARE
In seconds, you can calculate your market share and understand the influence of different market dynamics and competitors on your sales! This is a powerful, data-driven approach to identifying areas of strength and weakness, enabling you to refine your marketing tactics for maximum effectiveness.
To achieve this, we’ll add a new Mapline Data column to your business locations dataset that lists the market share for each of your business locations.
With your dataset still open, click the MAPLINE DATA button. Name your new dataset column MY MARKET SHARE, select THIS DATASET as the source data, then choose CALCULATE A VALUE FOR EACH ROW IN THIS DATASET USING A FORMULA.
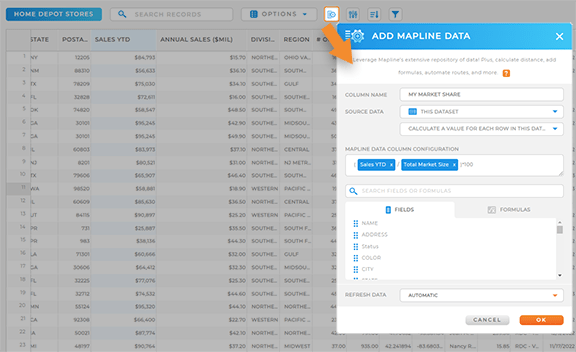
Now, click the dataset column that lists the REVENUE for each of your locations and drag it into the formula field. Do the same with the column that lists TOTAL MARKET SIZE, then type in this formula:
(REVENUE / TOTAL MARKET SIZE)*100
This calculation will yield your market share for each location. Do the same to each of your competitor locations so you can compare and contrast.
But it doesn’t stop there! Leverage Mapline Data to run additional market share calculations that best suit your analysis:
- Calculate market share for your locations
- Estimate competitor revenue or customer count in the same areas
- Use market data to determine the total potential market size in each area

Pro Tip: Add your competitor analysis to your market analysis for even deeper insights! Analyze your competitors strengths and weaknesses to identify where you have a competitive edge in each market. This is a powerful way to set yourself apart from the competition!
VISUALIZE YOUR MARKET ON A MAP
Get a visual representation of your market in minutes! Seeing different market areas and data on a map makes it possible to analyze your market at lightning speed, giving you more time to craft strategic campaigns that empower your team to dominate the market. Check out these powerful ways to leverage your customer market map and get an in-depth market analysis in minutes.
ADD GOVERNMENT BOUNDARIES
See how your campaigns perform in different demographic and socioeconomic areas. Add government boundaries to your map to custom-tailor your campaigns to specific regions based on their unique characteristics and consumer behaviors.
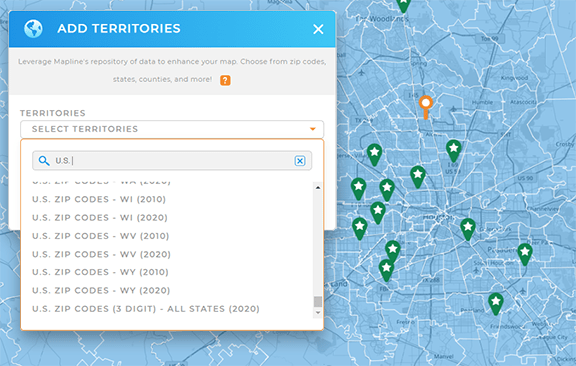
Open your customer market map and click the ADD menu in the top-left corner of your map. Hover over TERRITORIES and select FROM MAPLINE’S REPOSITORY.
From here, you can add any of the following U.S. government boundaries to your map:

Pro Tip: Do you operate internationally? Add worldwide government and administrative boundaries to your map in seconds! Just search for the country you need, and watch as the latest government and administrative boundaries available appear on your map!
ADD CUSTOM BOUNDARIES
Alternatively, add custom boundaries to your map to outline specific regions defined by your business objectives, such as demographic profiles, service area coverage, or areas with high competitor saturation.
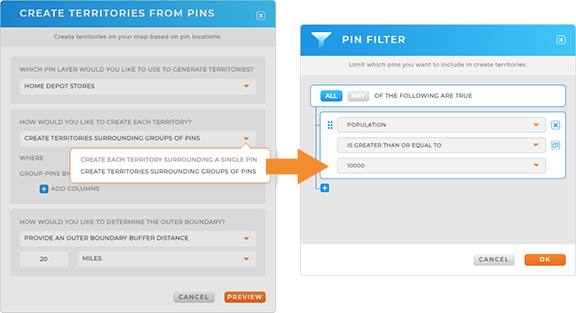
For example, let’s create market areas around population centers of 10,000 people or more on your map. Just click the ADD menu, hover over TERRITORIES, and select USING MAP LAYER PINS. Select the pin layer containing your business locations, then customize your territory settings. Apply the following filter, plus any additional filters you need: POPULATION IS GREATER THAN OR EQUAL TO 10,000.
If you’re grouping multiple pins together, select GROUP PINS BY > POPULATION. Customize your outer boundary settings, click PREVIEW, and click SAVE when you’re satisfied with your territory boundaries.
Now your map will display territories around your pins where the population is greater than or equal to 10,000 residents. How incredible is that?

Pro Tip: Enhance your territory data with additional demographics, such as householder age or family income levels. This is a fantastic way to analyze regional markets and understand the factors impacting sales!
VISUALIZE MARKET SHARE BY AREA
Once you’ve added boundaries to your map, it’s time to dive into a regional market analysis! See market share by area, as well as other key information for each of your territories.
Let’s take advantage of the market share calculation we did earlier in this article to quickly color-code your territories by market share.
First, let’s import the data from our market share analysis into your territory dataset. This will allow us to visualize this data on the map.
Click your territory pin layer in the map sidebar and select ADD MAPLINE DATA. Name your new dataset column MY MARKET SHARE, click A DATASET FROM MY LIBRARY, and select your business locations dataset as the source data.
For the calculation type, select AGGREGATE VALUES OF SPECIFIC DATASET PINS LOCATED INSIDE EACH TERRITORY, then adjust your Mapline Data column configurations to return the SUM OF MY MARKET SHARE. Apply any necessary filters, then click OK.
Now, this data has been added to your territory dataset, giving us the power to visualize it on the map! Click your territory map layer again and select STYLE from the pop-out menu.
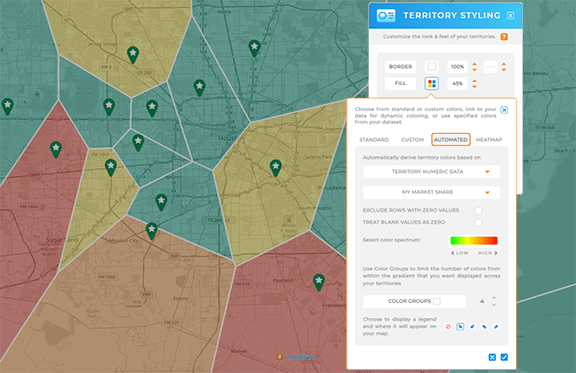
Under FILL color, select the AUTOMATED tab, select TERRITORY NUMERIC DATA and choose MY MARKET SHARE as the source data column. Customize your dynamic territory style settings, then click the blue checkmark. Make any final adjustments to your border or fill opacity, then click OK to apply your changes.
Now you have a dynamically-styled map of your market share in each region, making it easy to pinpoint which areas need the most attention! What an incredible way to see and understand the markets surrounding your locations.
SKYROCKET YOUR ROI
Now that your market analysis is complete, here are some other powerful ways to maximize campaign performance and skyrocket your ROI this year:
- Craft revenue-focused sales territories to optimize performance
- Monitor customer engagement in real-time and automate your nurture sequences
- Streamline your event management and track tasks, deadlines, and even performance in the moment
- Run a comprehensive competitor analysis to understand market overlap and competitor saturation
