How-To Guide
View Coverage Area Report
- How-To Guide
- VIEW COVERAGE AREA REPORT
Coverage areas provide a unique lens through which you can gain insights and identify opportunities. They help you visualize data within a specific geographic range, making it easier than ever to spot trends, anomalies, or potential areas for improvement. With coverage areas, you’re on the path to discovering valuable information that can enhance operations and boost your success.
Let’s dive in to how to access the key data that exists within your coverage areas.
VIEW COVERAGE AREA DATA
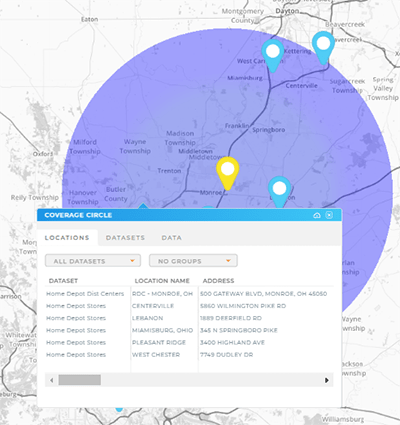
Simply click on any coverage area, and voila! You’ll see a snapshot of all the data within that specific radius.
Toggle between the LOCATIONS, DATASET, and DATA tabs to view different snapshots of information.
LOCATIONS: See data pertaining to all of the locations on your map that exist within this area. Click the DATASETS drop-down menu to toggle between datasets. Or, click the GROUPS drop-down menu to group your data by specific criteria from your dataset columns, such as state, division, or region.
DATASET: See which datasets your report stems from.
DATA: View data pertaining to the coverage area itself, including radius, diameter, and circumference.

DOWNLOAD YOUR REPORT
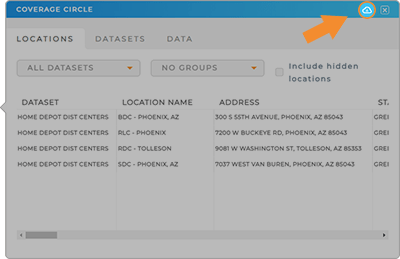
Want to save this data for future reference? Download a report by clicking the cloud icon in the top-right of the report window.
Then, you can add it to your existing spreadsheets or upload it as a new dataset! How awesome is that?


