Quick Reference Guide
GEOMETRIC MIDPOINT
- Quick Reference Guide
- GEOMETRIC MIDPOINT
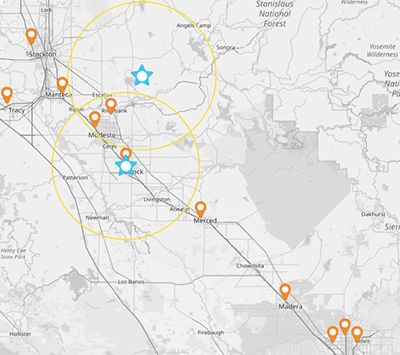
Discover how center points can sharpen your location strategy. By analyzing the geographic center of your existing map pins, you’ll unlock new layers of insight—revealing patterns in market coverage and helping you quantify how distance influences efficiency and ROI.
Take retail expansion, for example: when entering a new metro area, you can identify the most strategic spot for a new store based on the average distance from your current locations. This helps you improve customer accessibility while minimizing overhead and delivery costs.
Whether you’re optimizing store placement, fleet dispatching, or territory design, center points give you the clarity to make faster, smarter, location-based decisions that drive measurable results.
ADD GEOMETRIC MIDPOINT
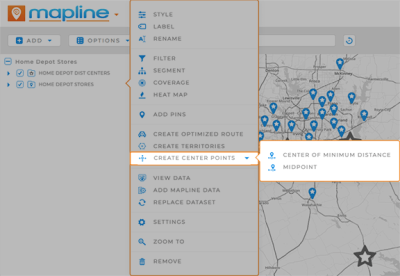
Next, let’s learn how to add midpoint(s) to your map. Visualizing the geographic center between your locations empowers you to identify optimal meeting places, distribution centers, or service areas that are equidistant from key points of interest.
This can improve coordination and logistics by reducing travel time and costs for both your team and customers.
Additionally, midpoints can be used to balance workloads and ensure that resources are evenly distributed, enhancing overall operational efficiency.
By leveraging midpoints, you’ll be better-equipped to make data-driven decisions that enhance accessibility, improve customer service, and streamline operations.
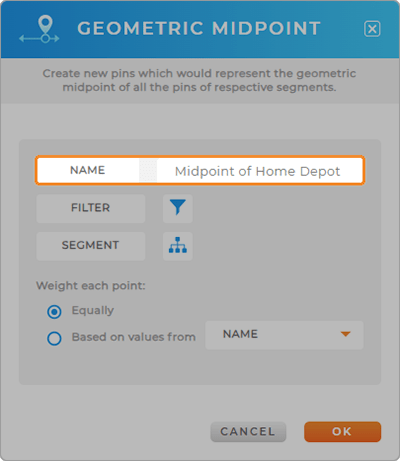
APPLY FILTERS
Now, apply any applicable filters to visualize specific subsets of data, such as only visualizing active customers or locations earning at least $75K annually.
Just click the FILTER icon, select the dataset column you need, then configure your calculation. Add as many filters as you need, then click OK to apply your changes.
This is a great way to focus on high-value segments when generating center points. Direct your resources where they’ll have the greatest impact and watch your ROI skyrocket!

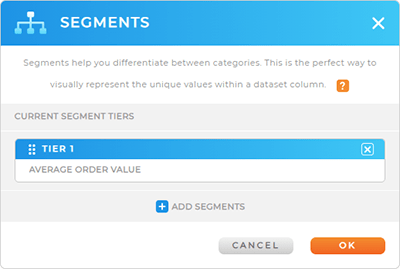
APPLY SEGMENTS
Finally, apply any relevant segments, such as division, region, or average order value. This will help you color-code your center points based on the values that matter to you.
This makes it possible to visually differentiate between different strategic areas, making it easier to identify trends and opportunities. Select the market segments that will reveal deeper insights into your team’s performance and operational efficiency. When you’re done, click OK to apply your changes.
WEIGH POINTS
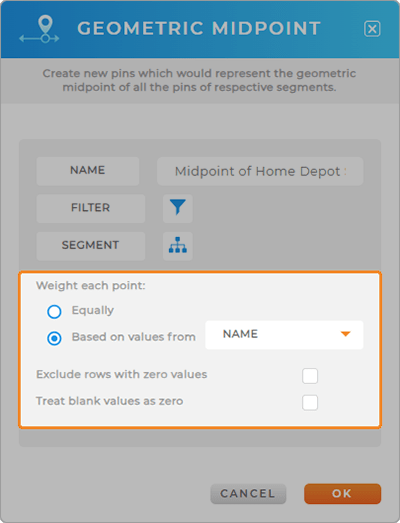
If you’re calculating a midpoint, you’ll also select your desired point weights. Choose from the following:
- Weigh Equally: Each location in your dataset receives equal consideration when calculating the midpoint
- Weigh Based on Column Values: Adjust weights based on specific metrics from your dataset columns
- Exclude rows with zero values: Leave out rows where numeric data equals zero
- Treat blank values as zero: Consider blank cells in the dataset as zero
These options empower you to prioritize locations based on sales volume or customer density, focus on actionable insights, and make more informed decisions.
By incorporating these values into your midpoint calculations, you not only pinpoint the center between locations but also enhance your analysis with data that drives significant outcomes. What a powerful way to optimize strategies and achieve impactful results!
CENTER OF MINIMUM DISTANCE vs MIDPOINT-
WHAT’S THE DIFFERENCE?
The center of minimum distance is the point of absolute minimum travel distance. Adding these points to your map helps reduce mileage, pinpoint travel challenges, and streamline logistics like never before.
The midpoint, on the other hand, is the exact middle point between locations on a map. In other words, it’s the exact point that lies equidistant from the locations in question, calculated based on their coordinates. This point can be useful for determining central meeting spots or for dividing regions into equal parts.
HONE IN ON NEW INSIGHTS
Now, your map is ready to go with new center points! Here are some common ways other brands leverage center points to get the most out of their analytics:
- Customize your pin colors for quick identification
- Visualize coverage areas around your center points for easy analysis
- Run distance calculations between your center points and other locations on your map
